NodeJS in Flames
May 2021 • 8 min read
Hi, let’s do a quick POV.
You are a software engineer building amazing products, shipping them to production and telling bad jokes on Twitter. Once or twice a month when Mercury is in retrograde, you are confronted with a complex bug on production. A part of the code seems to be hogging CPU on the server and sometimes taking it down.
You have tried to reproduce in other environments, but you can’t. Figuring it out as it happens on prod seems to be the only option. How do you solve this?
This post attempts to help with an answer to that, by discussing CPU profiling with flame-graphs using NodeJS as the target runtime. Although it uses Node, it’s been intentionally written in a way that would get you started with profiling CPU for any known process or application once you have its Process ID.
Background on CPU Profiling and Flame-graphs
Profiling is a method used to get empirical information about the performance of code paths in software. It’s a really useful means of determining performance bottlenecks and finding performance wins in a system. A bottleneck might start out inconsequential, but as systems scale it will become more prominent.
Profiling tools have various ways of displaying the information, which are often specific to the language in question. For example, here’s how it looks if you run node with the profile option (—prof) enabled 1:
[Shared libraries]:
   ticks  total  nonlib   name
     59   17.2%          [vdso]
     30    8.7%          /lib/x86_64-linux-gnu/libc-2.24.so

 [JavaScript]:
   ticks  total  nonlib   name
      1    0.3%    0.4%  Script: ~<anonymous> internal/url.js:1:11
      1    0.3%    0.4%  LazyCompile: ~stringToFlags internal/fs.js:25:23
...

 [C++]:
   ticks  total  nonlib   name
     66   19.2%   26.0%  node::(anonymous namespace)::ContextifyScript::New(v8::FunctionCallbackInfo<v8::Value> const&)
     17    5.0%    6.7%  node::InternalModuleStat(v8::FunctionCallbackInfo<v8::Value> const&)
     15    4.4%    5.9%  node::Binding(v8::FunctionCallbackInfo<v8::Value> const&)
      7    2.0%    2.8%  node::Read(v8::FunctionCallbackInfo<v8::Value> const&)
      4    1.2%    1.6%  v8::internal::Heap::AllocateFixedArrayWithFiller(int, v8::internal::PretenureFlag, v8::internal::Object*)
...
It can quickly become cumbersome to go through all the lines to figure out where the bottlenecks are. This is a classic data visualization problem - how do we aggregate data and present it in a way humans can make sense of? e.g. pie charts, bar charts and in the case of profiling, flame-graphs.
Flame-graphs help visualize profiling data which could become hundreds of lines long. They are also a useful way to just figure out everything that your code is doing, including the syscalls 2. In the context of profiling a single process, each bar in the graph represents a function. The runtime of which may include executing another function. These “child” functions are stacked on top of their parents on the graph.
Here’s how to interpret a flame-graph:
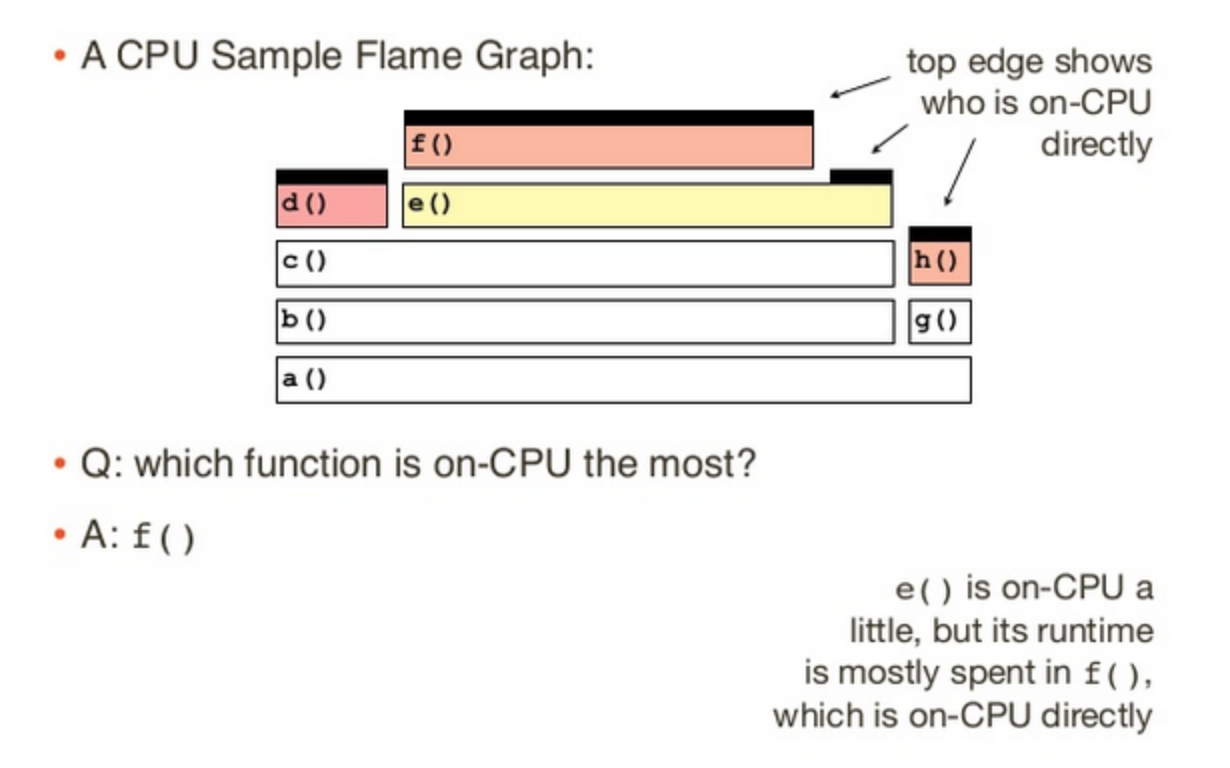 Source: https://netflixtechblog.com/java-in-flames-e763b3d32166
A function that has no stacks on top of it is running On-CPU. This means the function is where the CPU spent its time in that period. Child functions increase the duration of their parents, and this propagates down the graph.
You can figure out what is consuming CPU resources by looking for what process spends the most time on-CPU after generating the flame-graph.
When you consider that the code you write is powered by underlying frameworks and sometimes modules which may be the source of an issue, being able to profile to get empirical evidence is important.
Profiling NodeJS CPU
Background on Profiling JIT-Compiled Languages
Before we talk about profiling Node, let’s gain some understanding of how languages like Node are profiled. This would help you understand the strategies for similar languages and even come up with your own strategy.
When tracing or profiling a language, the way it is implemented is a big factor. As a JIT-compiled language, Javascript is compiled into byte-code and then compiled into machine code at runtime. Profiling tools like perf use symbol tables to translate memory addresses into function and variable names, so that they can be read by us humans 3.
JIT-compiled languages don’t have symbol tables by default, which means If you profile these using perf, you’ll see symbols for the VM engine, but you won’t see the language-level context you might be expecting. e.g. NodeJS functions.
Perf 4 has solved for this by allowing the VM maintain a /tmp/perf-PID.map file for symbol translation. Java and Node have this implemented, adding that context to the resulting flame-graphs.
Practical - NodeJS Profiling Example
When trying to solve a performance problem like the one in our POV, there are various scenarios you can find yourself in. For the purpose of understanding basic profiling, we’ll limit it to two - profiling on the shell (external) and profiling the Node process itself (internal).
In both cases we’ll be use a basic framework:
- Run the code.
- Profile the CPU using perf.
- Use the perf report to generate a flame-graph.
- Interpret the flame-graph to see what function/code path is using up CPU.
To help create an actual scenario, I have added the code to a sample Github repository. In the NodeJS code there is a function that hogs CPU and increases the overrall time taken to process requests, making it problematic. I encourage you to clone the repo and follow along so you gain basic practical experience.
With each scenario there are two options - manual and with the sample repo. If you are trying to profile on your own application, you can try the manual option(s). If you’re just exploring and want to learn, use the sample repo.
#1 - Profiling the Node Process internally
This method demonstrates intrusive profiling by recording perf events directly when starting Node. It’s useful for direct profiling when trying to find a bottleneck.
#1.1 Manually
- Install perf. I wrote about doing this on MacOS here, but if you’re doing this on a Linux environment you can install from the package manager.
- Run the Node app with perf enabled
PORT=3000 ./perf record -e cycles:u -g -- node --perf-basic-prof app.js & - Use curl to call the endpoint containing the code path. This will cause the problematic function to run.
curl "http://localhost:3000/api/tick" curl "http://localhost:3000/api/end" - Create the flamegraph
  if [ ! -d FlameGraph ]
  then
  git clone https://github.com/brendangregg/FlameGraph
  fi

  # Remove un-needed stacks so we only see the Node stacks we need.
  ./perf script --header | egrep -v "( __libc_start| LazyCompile | v8::internal::| Builtin:| Stub:| LoadIC:|\[unknown\]| LoadPolymorphicIC:)" | sed 's/ LazyCompile:[*~]\?/ /' | ./FlameGraph/stackcollapse-perf.pl | ./FlameGraph/flamegraph.pl > flame1.svg

  cp flame1.svg "./out/flame-internal-$NODE_VERSION.svg"
#1.2 With Sample Repo
- Clone the repository if you haven’t already.
git clone https://github.com/OpeOnikute/node-example-flamegraph.git && cd node-example-flamegraph - Build the docker images and start the containers.
docker-compose up -d - Run the flame-internal.sh script on the container. A flamegraph will be generated and sent to the
/outdirectory on your machine.docker-compose exec node_8x ./flame-internal.sh
#2 - Profiling on the shell (bash)
This method demonstrates how you can profile an already-running Node process when you are connected to the shell. Useful when there’s an ongoing issue and you need to generate a flame-graph. It can also be adapted to profile another process as long as it has symbol tables generated.
#2.1 Manually
- Install perf. I wrote about doing this on MacOS here, but if you’re doing this on a Linux environment you can install from the package manager.
- Run your Node app with the
perf_basic_prof_only_functionsoption enabled. This enables perf find the Javascript symbols from the v8 engine, by generating a/tmp/node-PID.mapfile. - Run perf record to collect stacks from the running node process. Ensure you’re generating traffic to the application first. e.g. you can write a browser function that pings an endpoint every second.
./perf record -F99 -p "$(pgrep -n node)" -g -- sleep 30 - Create the flamegraph
  if [ ! -d FlameGraph ]
  then
  git clone https://github.com/brendangregg/FlameGraph
  fi

  # Remove un-needed stacks so we only see the Node stacks we need.
  ./perf script --header | egrep -v "( __libc_start| LazyCompile | v8::internal::| Builtin:| Stub:| LoadIC:|\[unknown\]| LoadPolymorphicIC:)" | sed 's/ LazyCompile:[*~]\?/ /' | ./FlameGraph/stackcollapse-perf.pl | ./FlameGraph/flamegraph.pl > flame1.svg

  cp flame1.svg "./out/flame-internal-$NODE_VERSION.svg"
#2.2 With Sample Repo
- Clone the repository if you haven’t already.
git clone https://github.com/OpeOnikute/node-example-flamegraph.git && cd node-example-flamegraph - Build the docker images and start the containers.
docker-compose up -d - Run the flame-external.sh script on the container. A flamegraph will be generated and sent to the
/outdirectory on your machine.docker-compose exec node_8x ./flame-external.sh
WARNING - the map file generated has been known to grow in size, which is why we are using the perf_basic_prof_only_functions option, which looks for less symbols than the -perf-basic-prof which can only be run for a couple of hours before the /tmp/perf-PID.map file becomes really big. Regardless, if you are running servers for long periods, you should watch the growth in size of the files and better still remove the option after you’re done profiling.
After running the steps above, open the generated flame-graph in your browser. If you used the sample repo, the results from internal and external profiling should look like this:
Internal

External

By interpreting the graph using the On-CPU method introduced in the Background section, we can see that the node process is using up CPU, and the section of our code with the issue is get /usr/src/app/node_modules/fast-levenshtein/levenshtein.js:27!
Conclusion
Congrats on making it this far! We’ve covered quite a bit in this post. Here are the highlights:
- Introduced CPU profiling, flame-graphs and how they are important.
- Talked about how JIT-Compiled languages are typically profiled with symbol tables.
- Explored profiling NodeJS CPU with two scenarios:
- When you can afford to run your Node process with profiling enabled (internal) - run
PORT=3000 ./perf record -e cycles:u -g -- node --perf-basic-prof app.js &and use perf reporting to generate the flamegraph after calling the endpoints. - When you can’t afford to run Node process with profiling enabled (external) - run
PORT=3000 node --perf_basic_prof_only_functions app.jsand use perf reporting to generate a flamegraph when there’s a CPU spike.
- When you can afford to run your Node process with profiling enabled (internal) - run
There is more to the topic than I have covered in this post. Some questions should’ve come to mind when you think about the reality of our production environments. For example:
- How can we do continuous profiling so we catch regressions in our codebases in deployments before they become a issue?
- What if we don’t have access to the prod server? Is there another way to do this profiling?
- Are flame-graphs the only way to represent this data?
Using APM tools we could do some of this profiling and graph them over time, and even track performance between deployments. I haven’t done as much exploration of what the reality of that looks like yet. I intend to do so soon and will be covering in subsequent posts, so keep an eye out!
Thanks to Griffith, Ife and Chidi for reading drafts of this.
Further Reading
- Easy profiling for Node.js Applications
- Flame Graphs in NodeJS Diagnostics
- node.js Flame Graphs on Linux - Brendan Gregg
Notes
-
More information about profiling this way can be found in this post - Easy profiling for Node.js Applications. ↩
-
A syscall is a way for programs to tell the kernel to perform an action or a service. e.g. allocate memory or create a new process. ↩
-
Symbol tables contain a mapping of functions to memory addresses. More information here. ↩
-
Perf is a linux tool also called perf_events. It is powerful - it can instrument CPU performance and is capable of lightweight profiling. It is included in the Linux kernel. ↩
To help me grow on Youtube and learn about Monitoring, Machine Learning, and SRE, please subscribe here.
And to get notifiied about new posts, please subscribe here.